
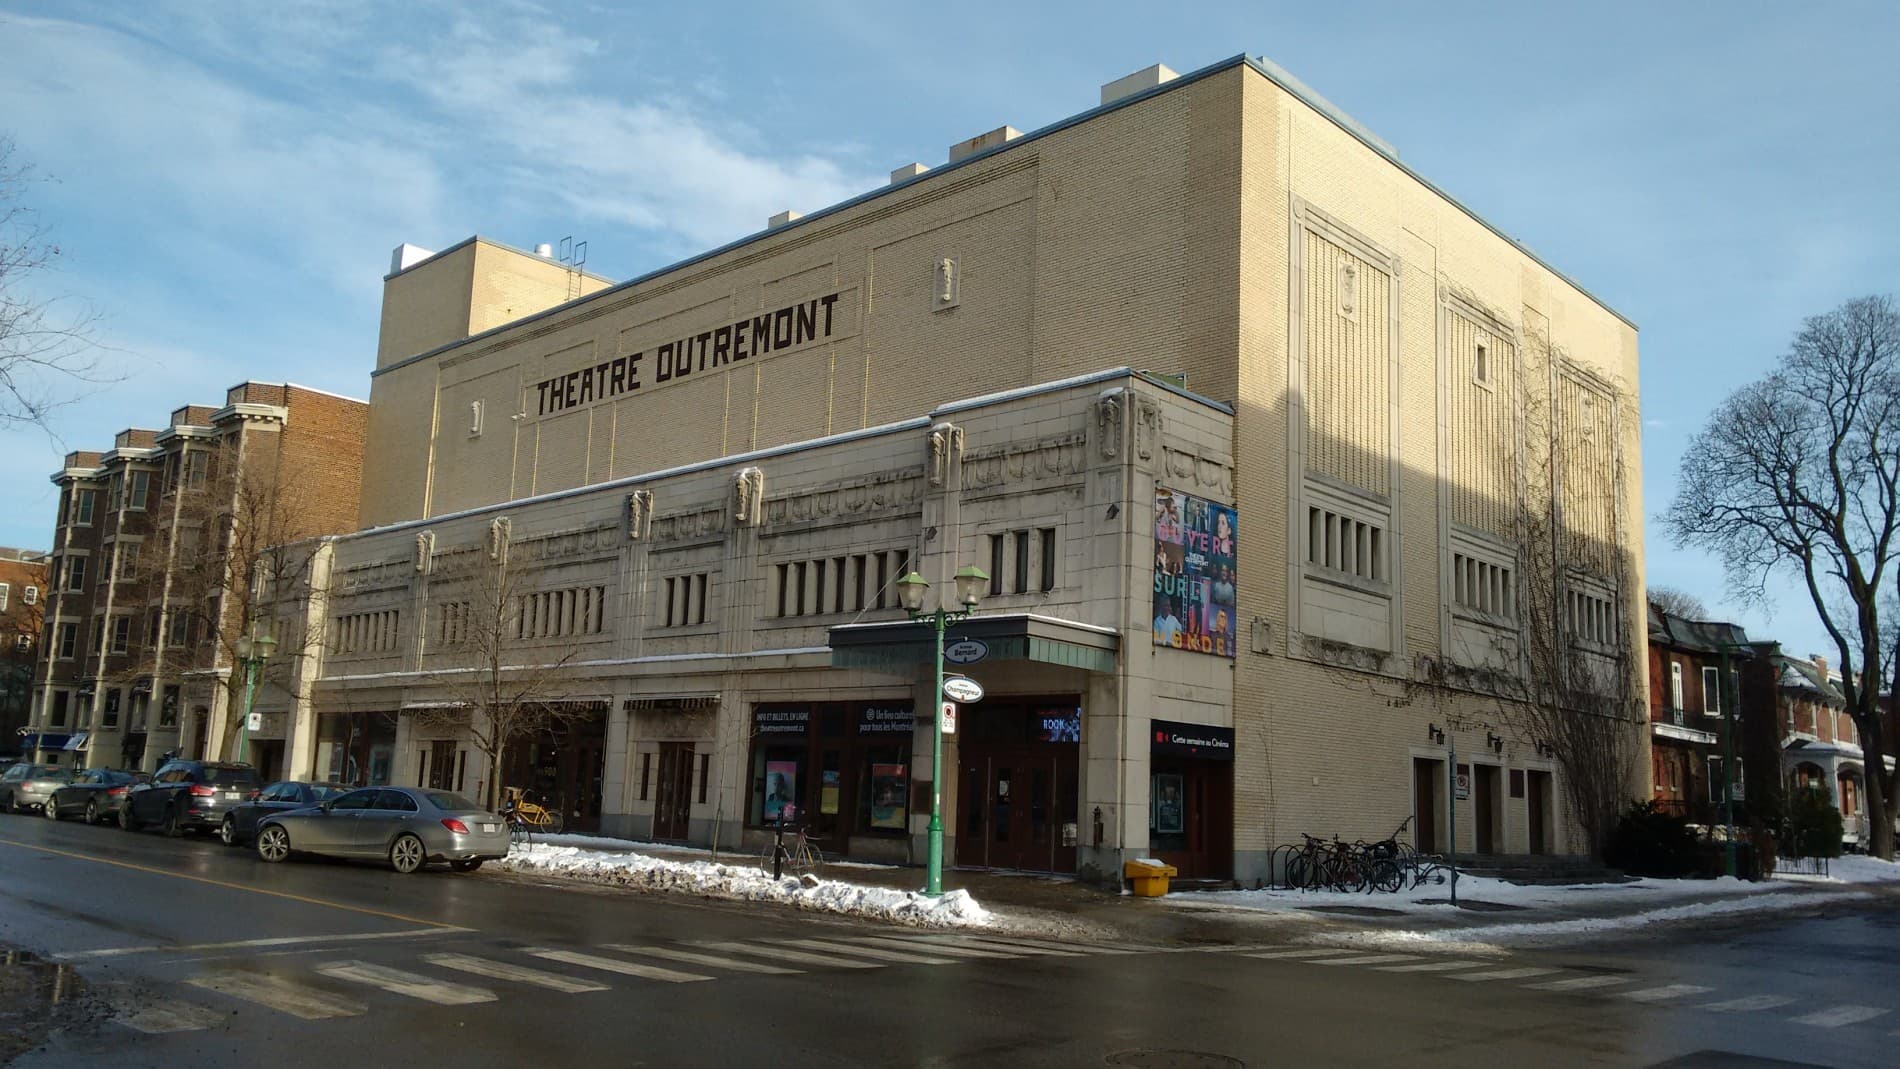
Your real estate brokerin Outremont
Architecture, location, street, property condition and scarcity strongly influence marketing and buying in Outremont.
Outremont market insights
A stable residential market at the quarter, driven by a sharp rise in new listings and single-family home prices up sharply year over year.
Q2 2026 market snapshot
These figures should be interpreted in light of the property's type, condition, street and particular features — a sector-wide statistic never replaces an individual valuation.
Our reading of the market
In Q2 2026, 67 residential properties sold in Outremont, unchanged from the same quarter last year — and up 11% on the trailing four-quarter total. New listings jumped 19% for the quarter (+20% on the trailing four-quarter total), and active listings also rose (+8% for the quarter, +2% on the trailing total), a sign of continued growth in supply. Sales volume fell 11% for the quarter but rose 11% on the trailing total. For single-family homes, the quarter's sales sample remains too small for a reliable figure, but their median price over the trailing four quarters ($2,201,700) rose 6%, and their time on market lengthened slightly (+3 days, to 67 days). Condominiums traded at a median price of $770,000 (-3% for the quarter, +6% on the trailing total), with time on market holding around 58 days. Plexes remain too few in Outremont to produce reliable figures.
- 67Stable compared with Q2 2025Sales completedQ2 2026
- 125+19% vs Q2 2025New listingsQ2 2026
- 162+8% vs Q2 2025Active listingsQ2 2026
- $92M-11% vs Q2 2025Sales volumeQ2 2026
- 239+11% vs the 4 quarters ending Q2 2025Sales completedTrailing 4 quarters
- 444+20% vs the 4 quarters ending Q2 2025New listingsTrailing 4 quarters
- 153+2% vs the 4 quarters ending Q2 2025Active listingsTrailing 4 quarters
- $336M+11% vs the 4 quarters ending Q2 2025Sales volumeTrailing 4 quarters
Number of transactions completed during the period — the sample size behind the other indicators.
Number of new active listings during the period.
Number of properties actively listed for sale at the end of the period — available supply, distinct from new listings.
Total value of all transactions completed during the period.
Compiled by Équipe Lefrançois from Centris data, extracted on September 17, 2026. Single-family homes, condominiums and plexes (2 to 5 units) — Outremont. Period analyzed: Q2 2026.
- 21Sales completedQ2 2026
- 32-13% vs Q2 2025Active listingsQ2 2026
- n/aMedian sale priceQ2 2026
- n/aMedian days on marketQ2 2026
- 72-2% vs the 4 quarters ending Q2 2025Sales completedTrailing 4 quarters
- 31-13% vs the 4 quarters ending Q2 2025Active listingsTrailing 4 quarters
- $2,201,700+6% vs the 4 quarters ending Q2 2025Median sale priceTrailing 4 quarters
- 67 days+3 days vs the 4 quarters ending Q2 2025Median days on marketTrailing 4 quarters
n/a = too few transactions to produce a reliable statistic.
Number of transactions completed during the period — the sample size behind the other indicators.
Number of properties actively listed for sale at the end of the period — available supply, distinct from new listings.
The price at which half of sold properties sold for more, and half for less — a measure less sensitive to extreme values than an average, never to be confused with a municipal property assessment.
Median number of days between listing and a completed sale.
Compiled by Équipe Lefrançois from Centris data, extracted on September 17, 2026. Single-family homes — Outremont. Period analyzed: Q2 2026.
- 43-2% vs Q2 2025Sales completedQ2 2026
- 115+16% vs Q2 2025Active listingsQ2 2026
- $770,000-3% vs Q2 2025Median sale priceQ2 2026
- 58 days+13 days vs Q2 2025Median days on marketQ2 2026
- 157+16% vs the 4 quarters ending Q2 2025Sales completedTrailing 4 quarters
- 107+9% vs the 4 quarters ending Q2 2025Active listingsTrailing 4 quarters
- $787,500+6% vs the 4 quarters ending Q2 2025Median sale priceTrailing 4 quarters
- 58 days-6 days vs the 4 quarters ending Q2 2025Median days on marketTrailing 4 quarters
Number of transactions completed during the period — the sample size behind the other indicators.
Number of properties actively listed for sale at the end of the period — available supply, distinct from new listings.
The price at which half of sold properties sold for more, and half for less — a measure less sensitive to extreme values than an average, never to be confused with a municipal property assessment.
Median number of days between listing and a completed sale.
Compiled by Équipe Lefrançois from Centris data, extracted on September 17, 2026. Condominiums — Outremont. Period analyzed: Q2 2026.
- 3Sales completedQ2 2026
- 14Active listingsQ2 2026
- n/aMedian sale priceQ2 2026
- n/aMedian days on marketQ2 2026
- 10Sales completedTrailing 4 quarters
- 14Active listingsTrailing 4 quarters
- n/aMedian sale priceTrailing 4 quarters
- n/aMedian days on marketTrailing 4 quarters
n/a = too few transactions to produce a reliable statistic.
Number of transactions completed during the period — the sample size behind the other indicators.
Number of properties actively listed for sale at the end of the period — available supply, distinct from new listings.
The price at which half of sold properties sold for more, and half for less — a measure less sensitive to extreme values than an average, never to be confused with a municipal property assessment.
Median number of days between listing and a completed sale.
Compiled by Équipe Lefrançois from Centris data, extracted on September 17, 2026. Plexes (2 to 5 units) — Outremont. Period analyzed: Q2 2026.
Looking to sell in Outremont?
The sharp rise in new listings (+19% for the quarter) calls for careful pricing from the outset, in a context where supply is growing faster than the number of quarterly sales.
Get my Outremont property valuedLooking to buy in Outremont?
The rise in active and new listings gives buyers more properties to compare, despite the continued year-over-year increase in single-family home prices (+6% on the trailing four-quarter total).
View properties in OutremontUnderstanding Outremont
Streets, parks and residential heritage
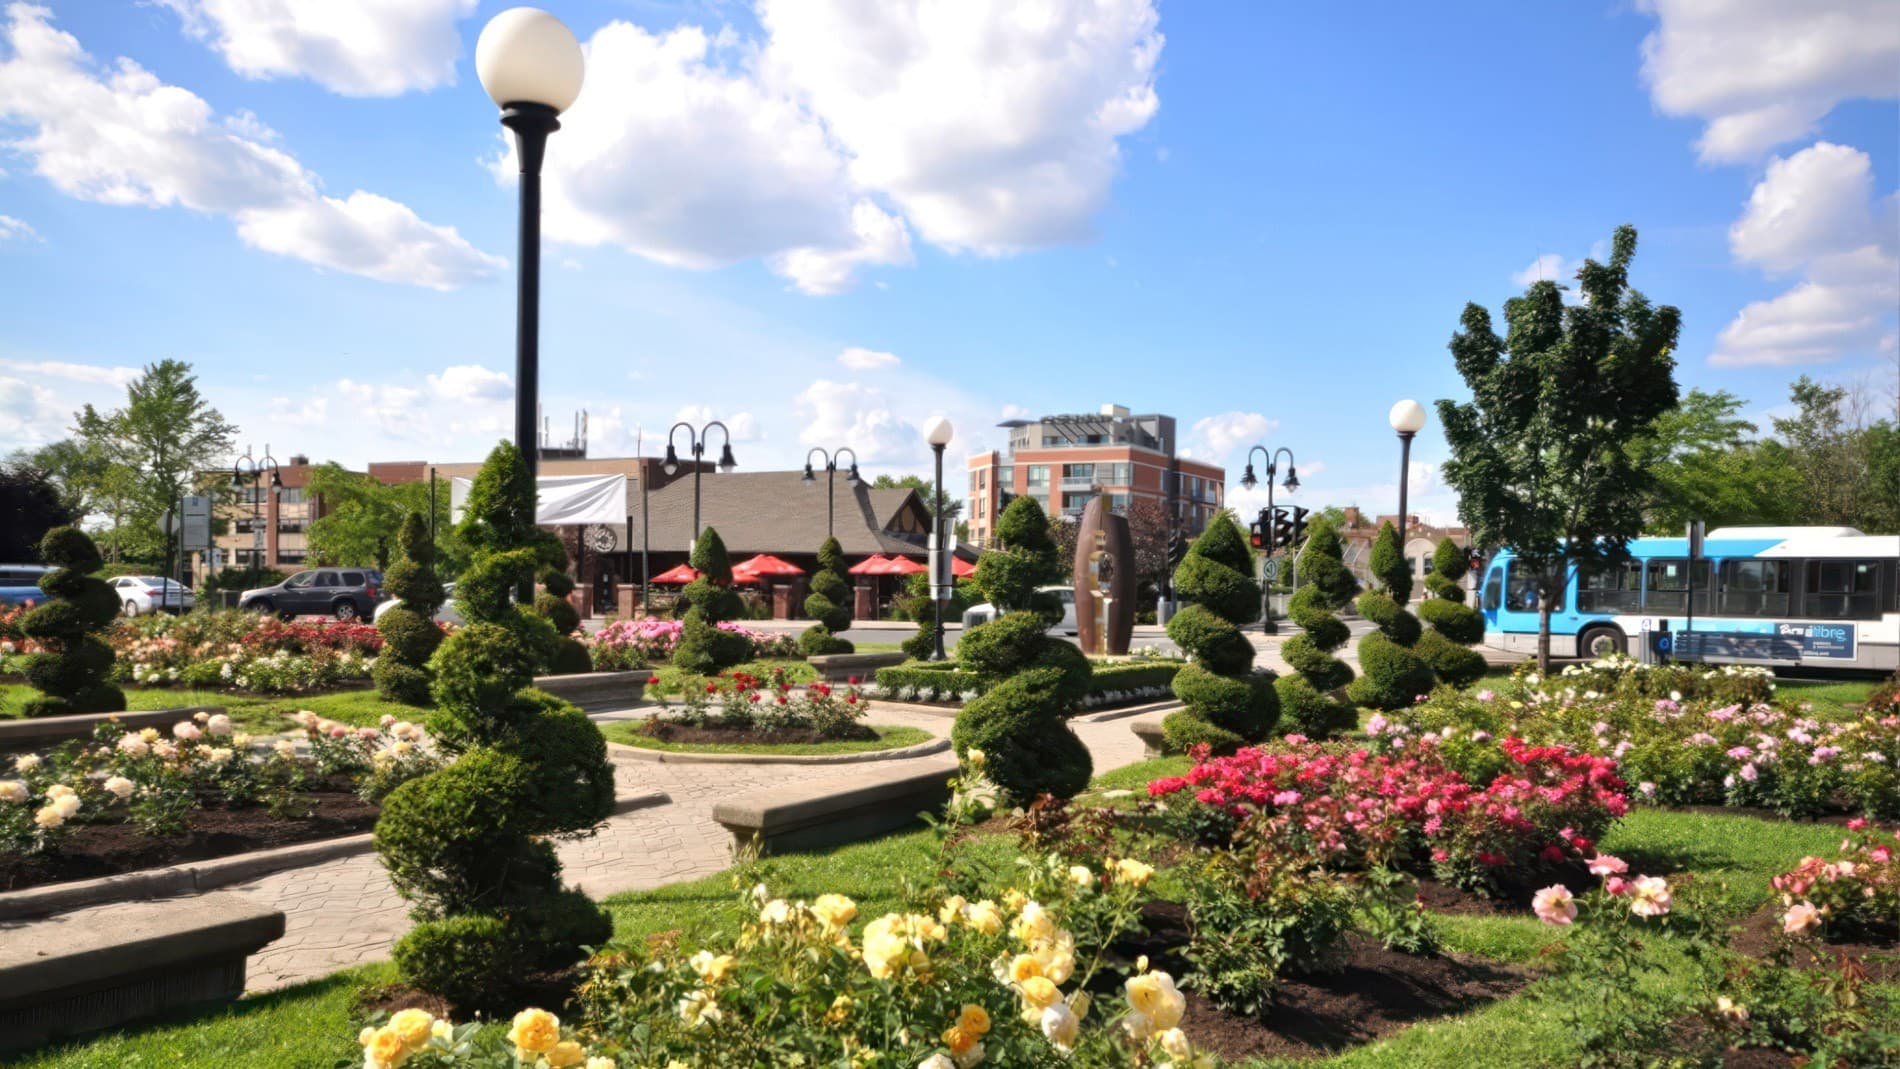
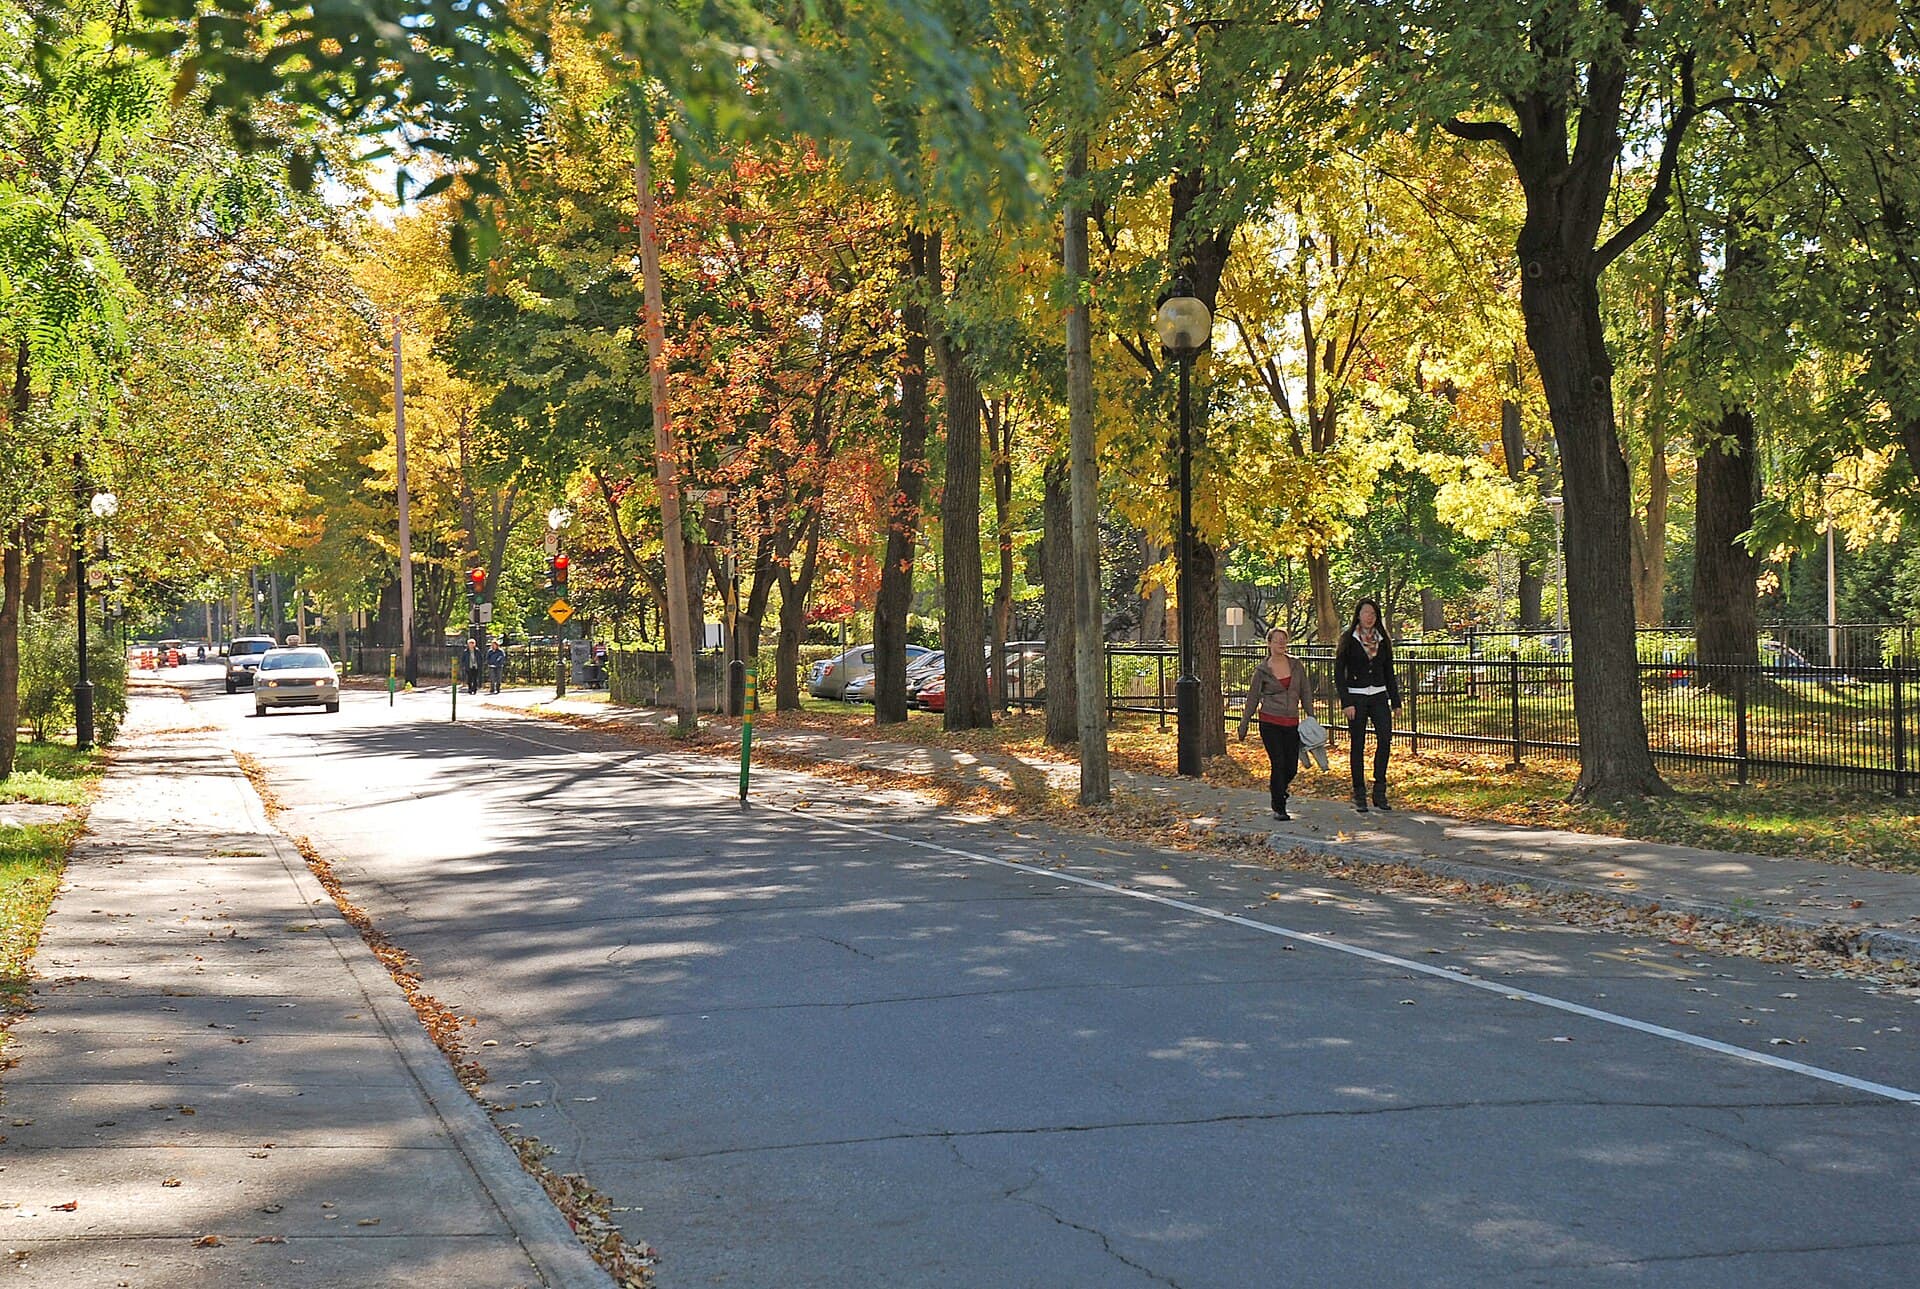
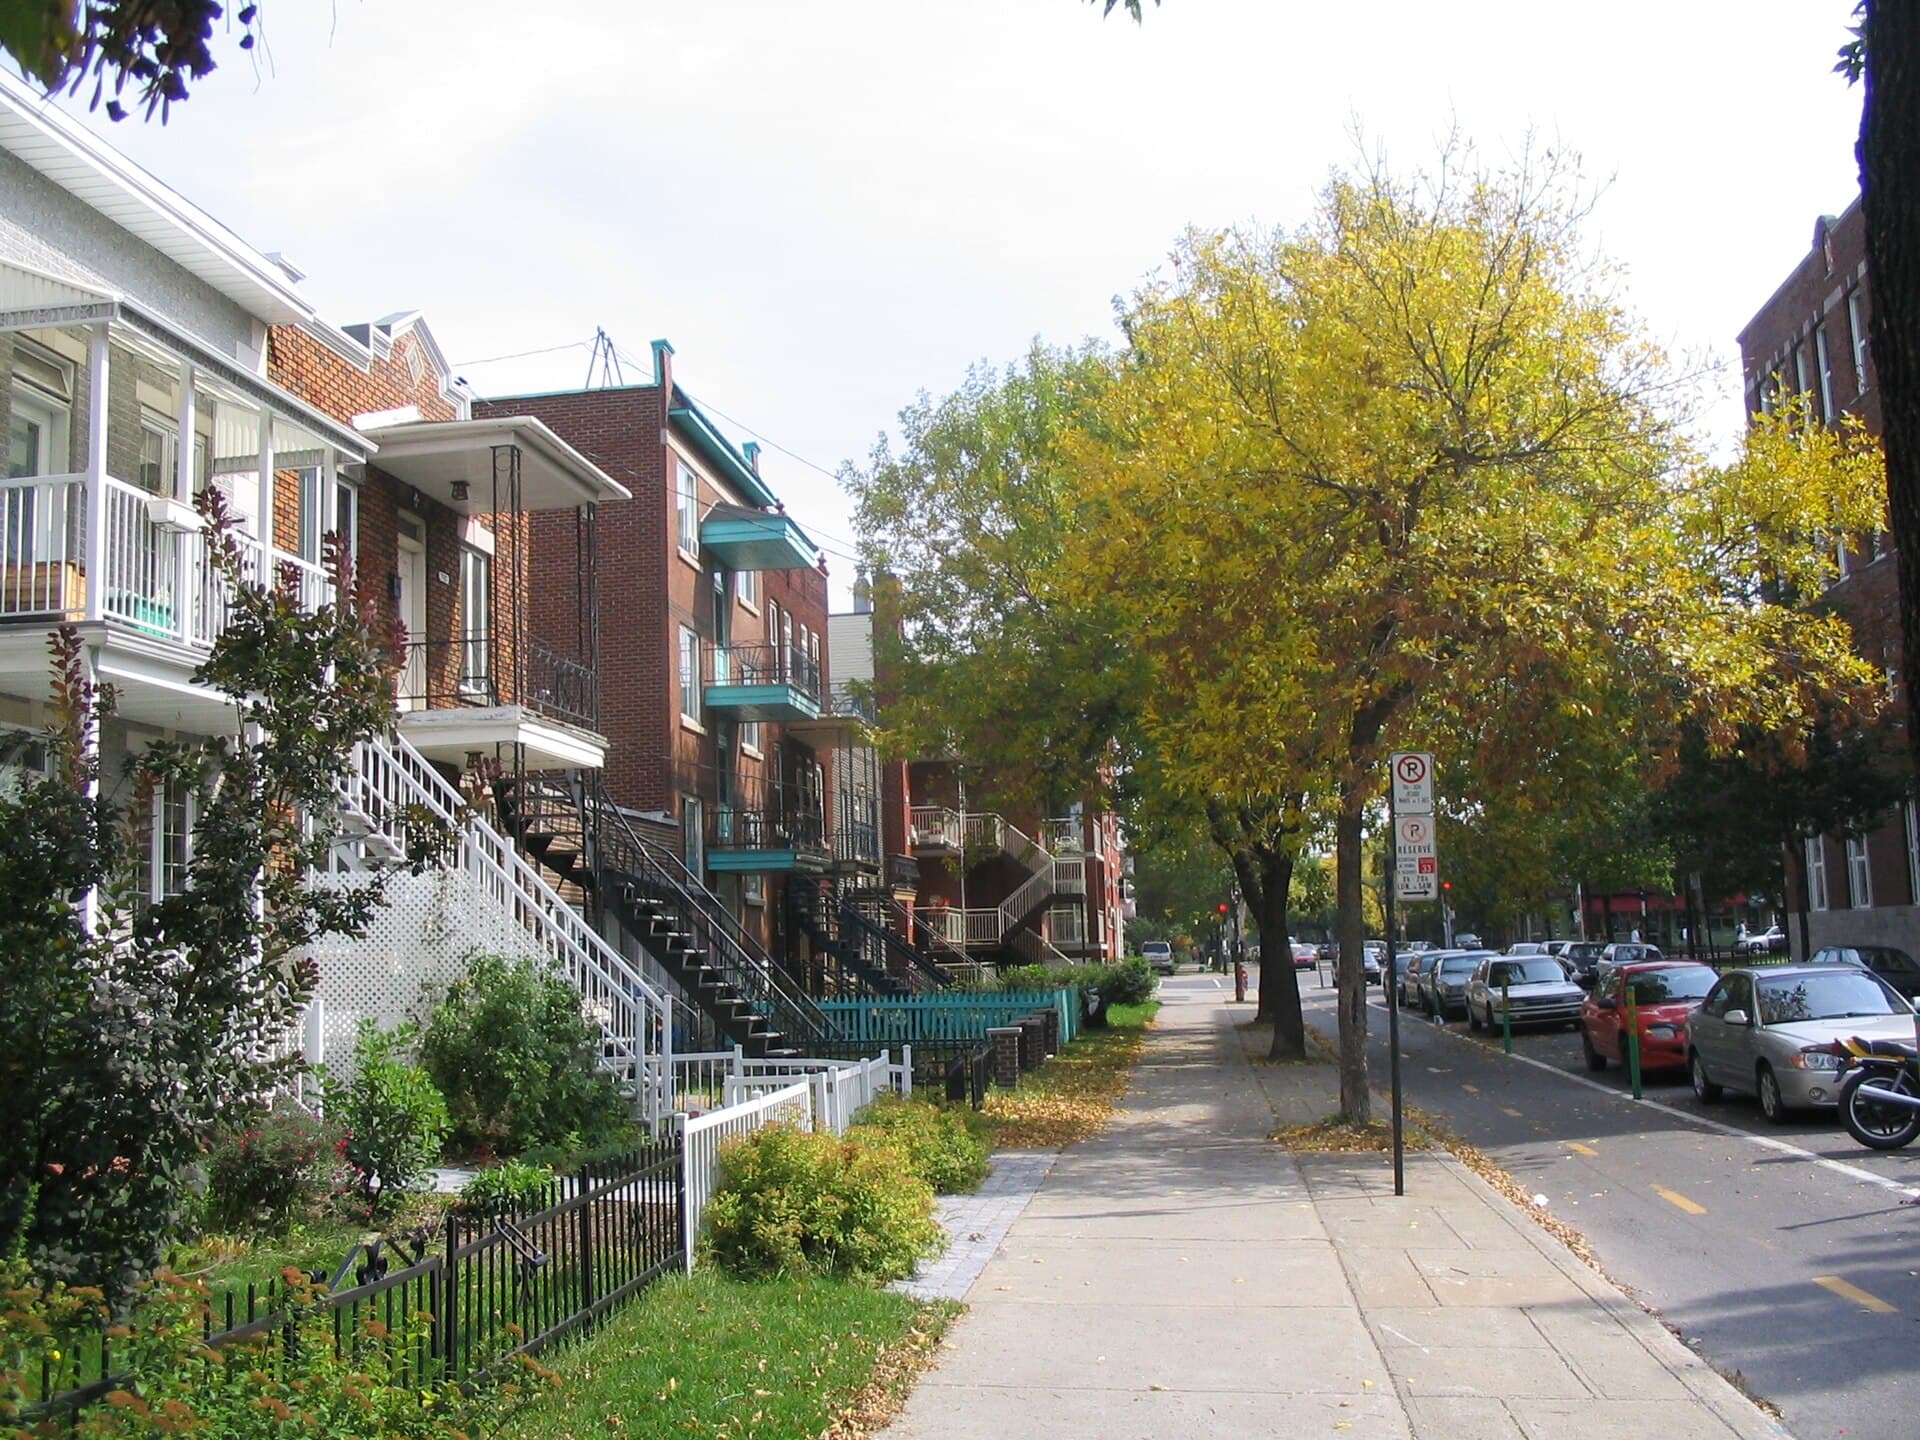
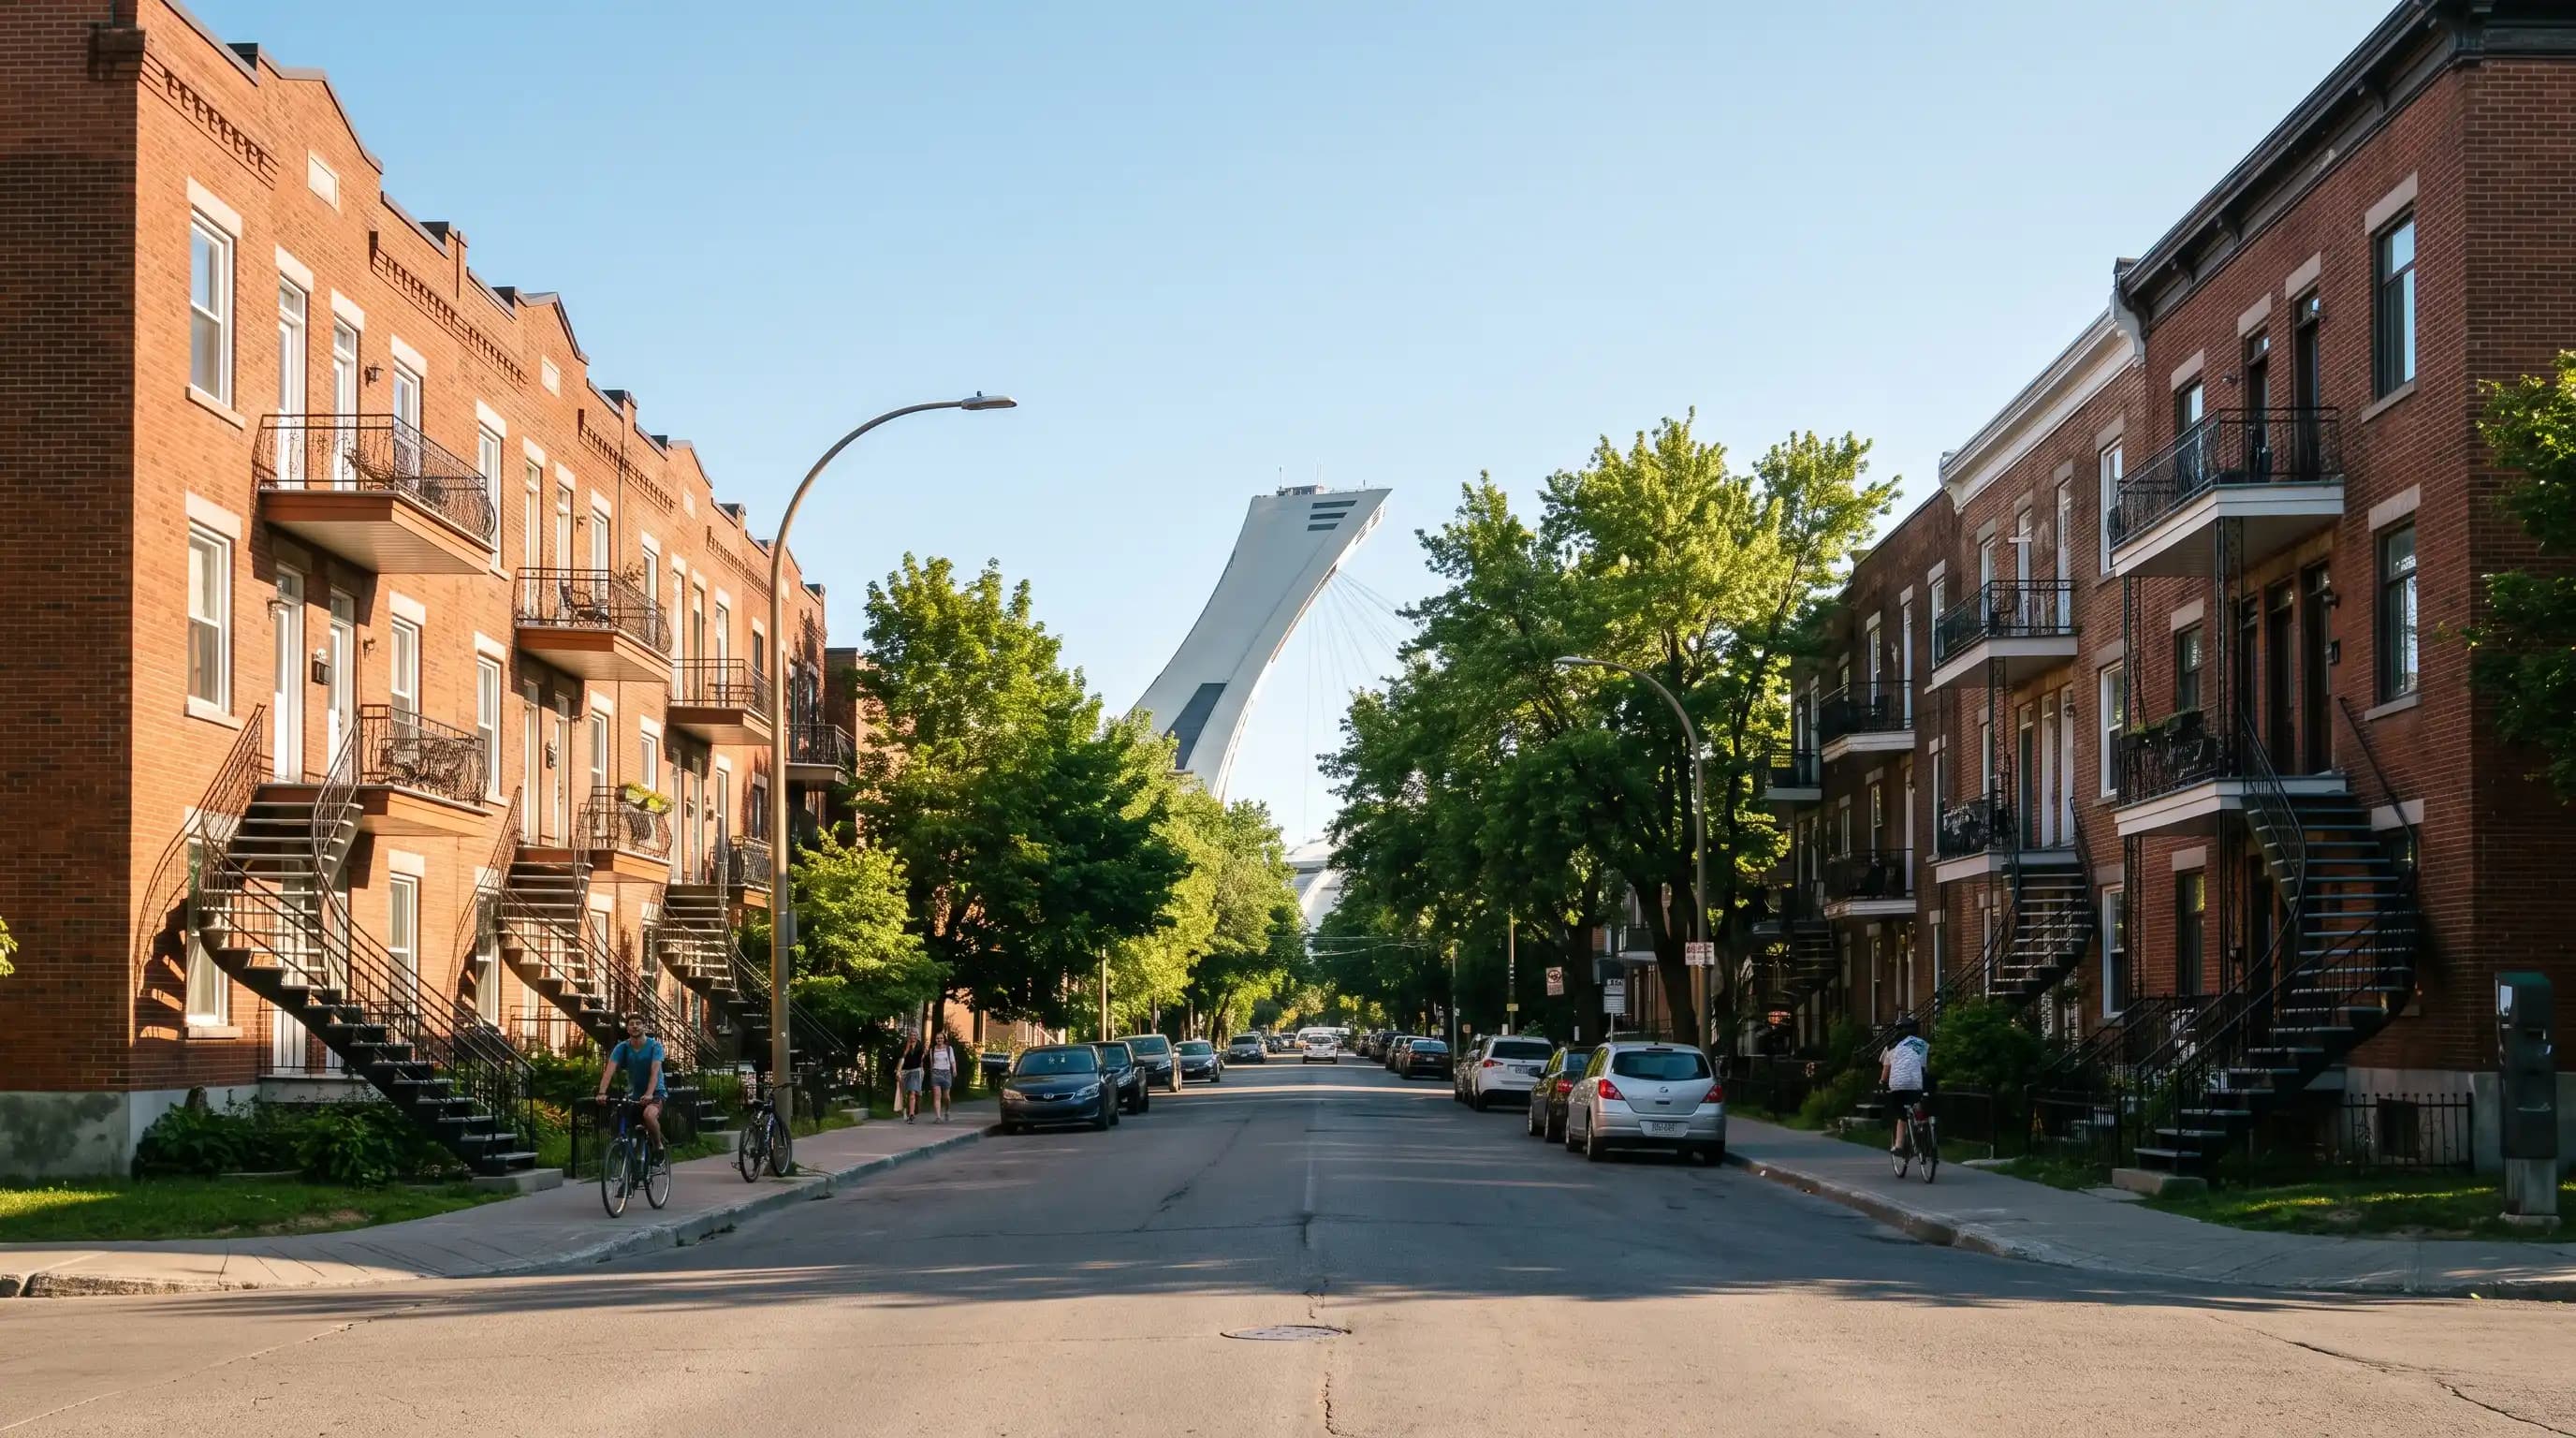
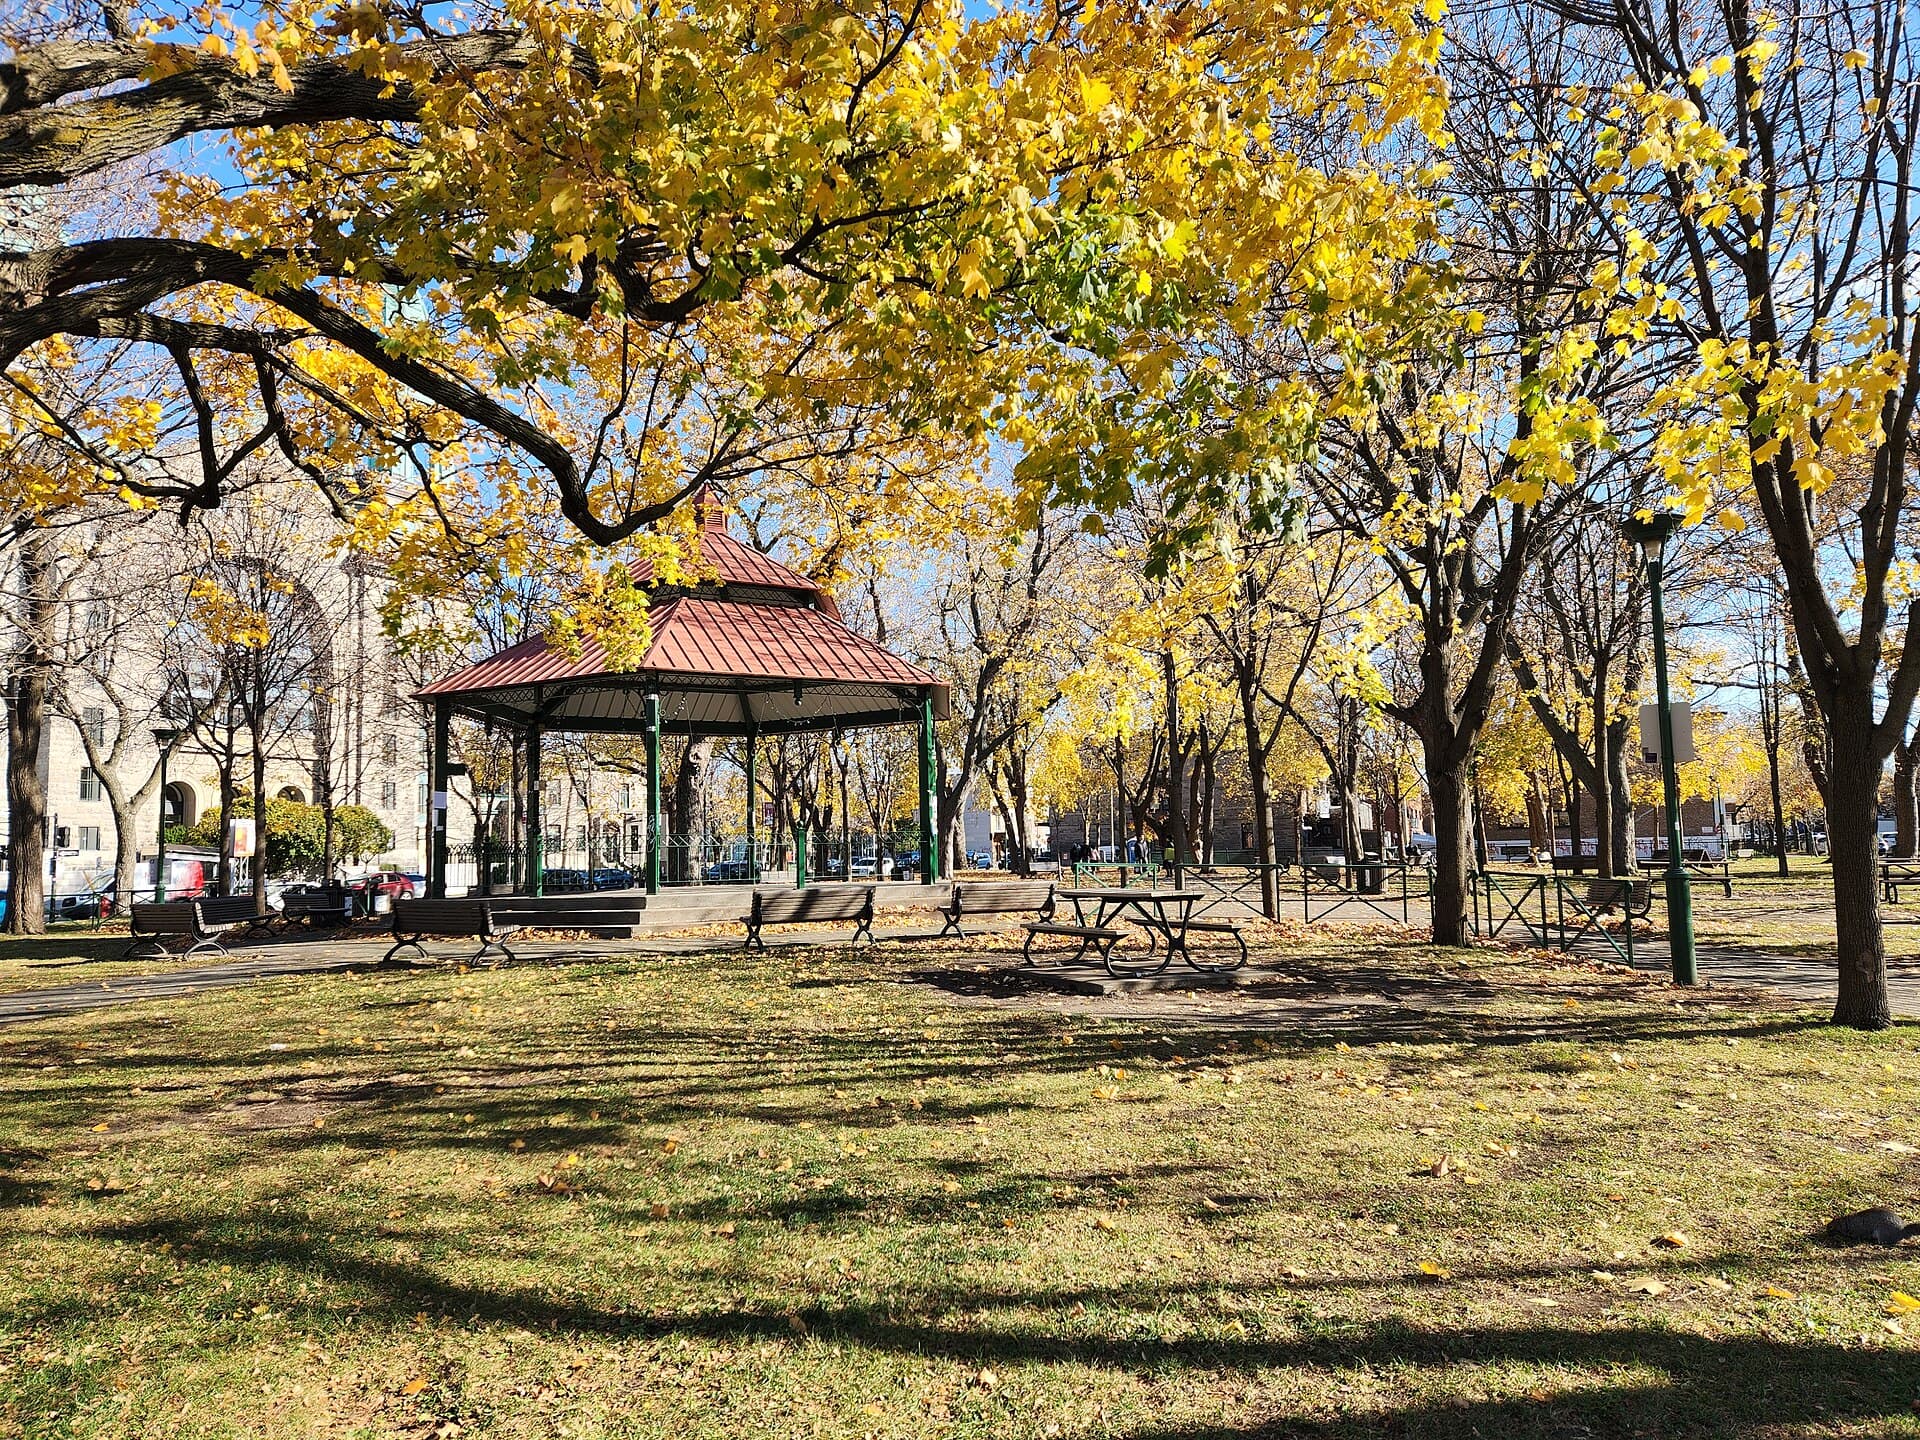
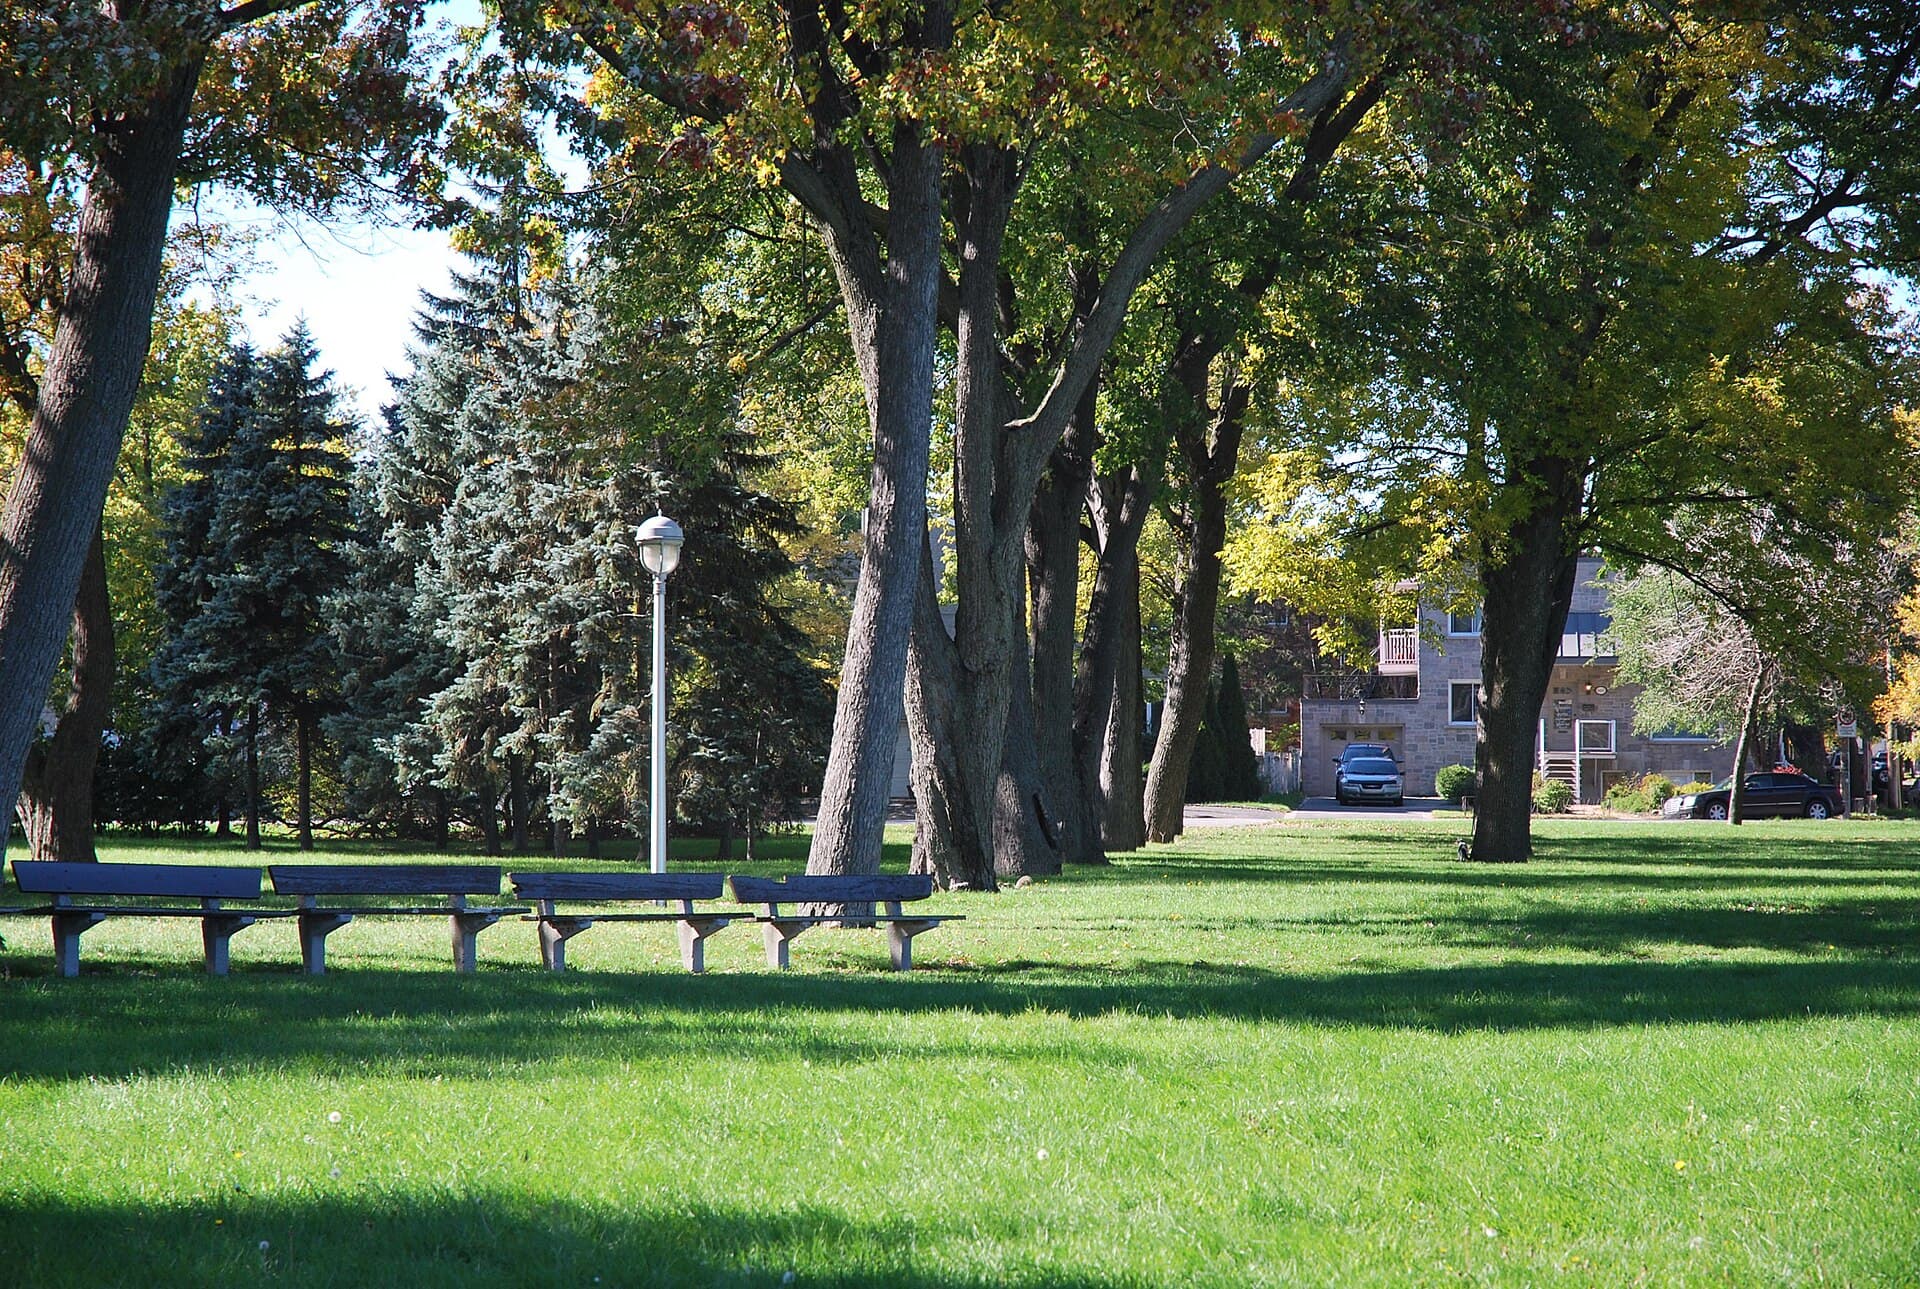
A neighbourhood known for its tree-lined streets, parks, residential heritage and proximity to downtown Montreal.
Bernard, Laurier and Van Horne
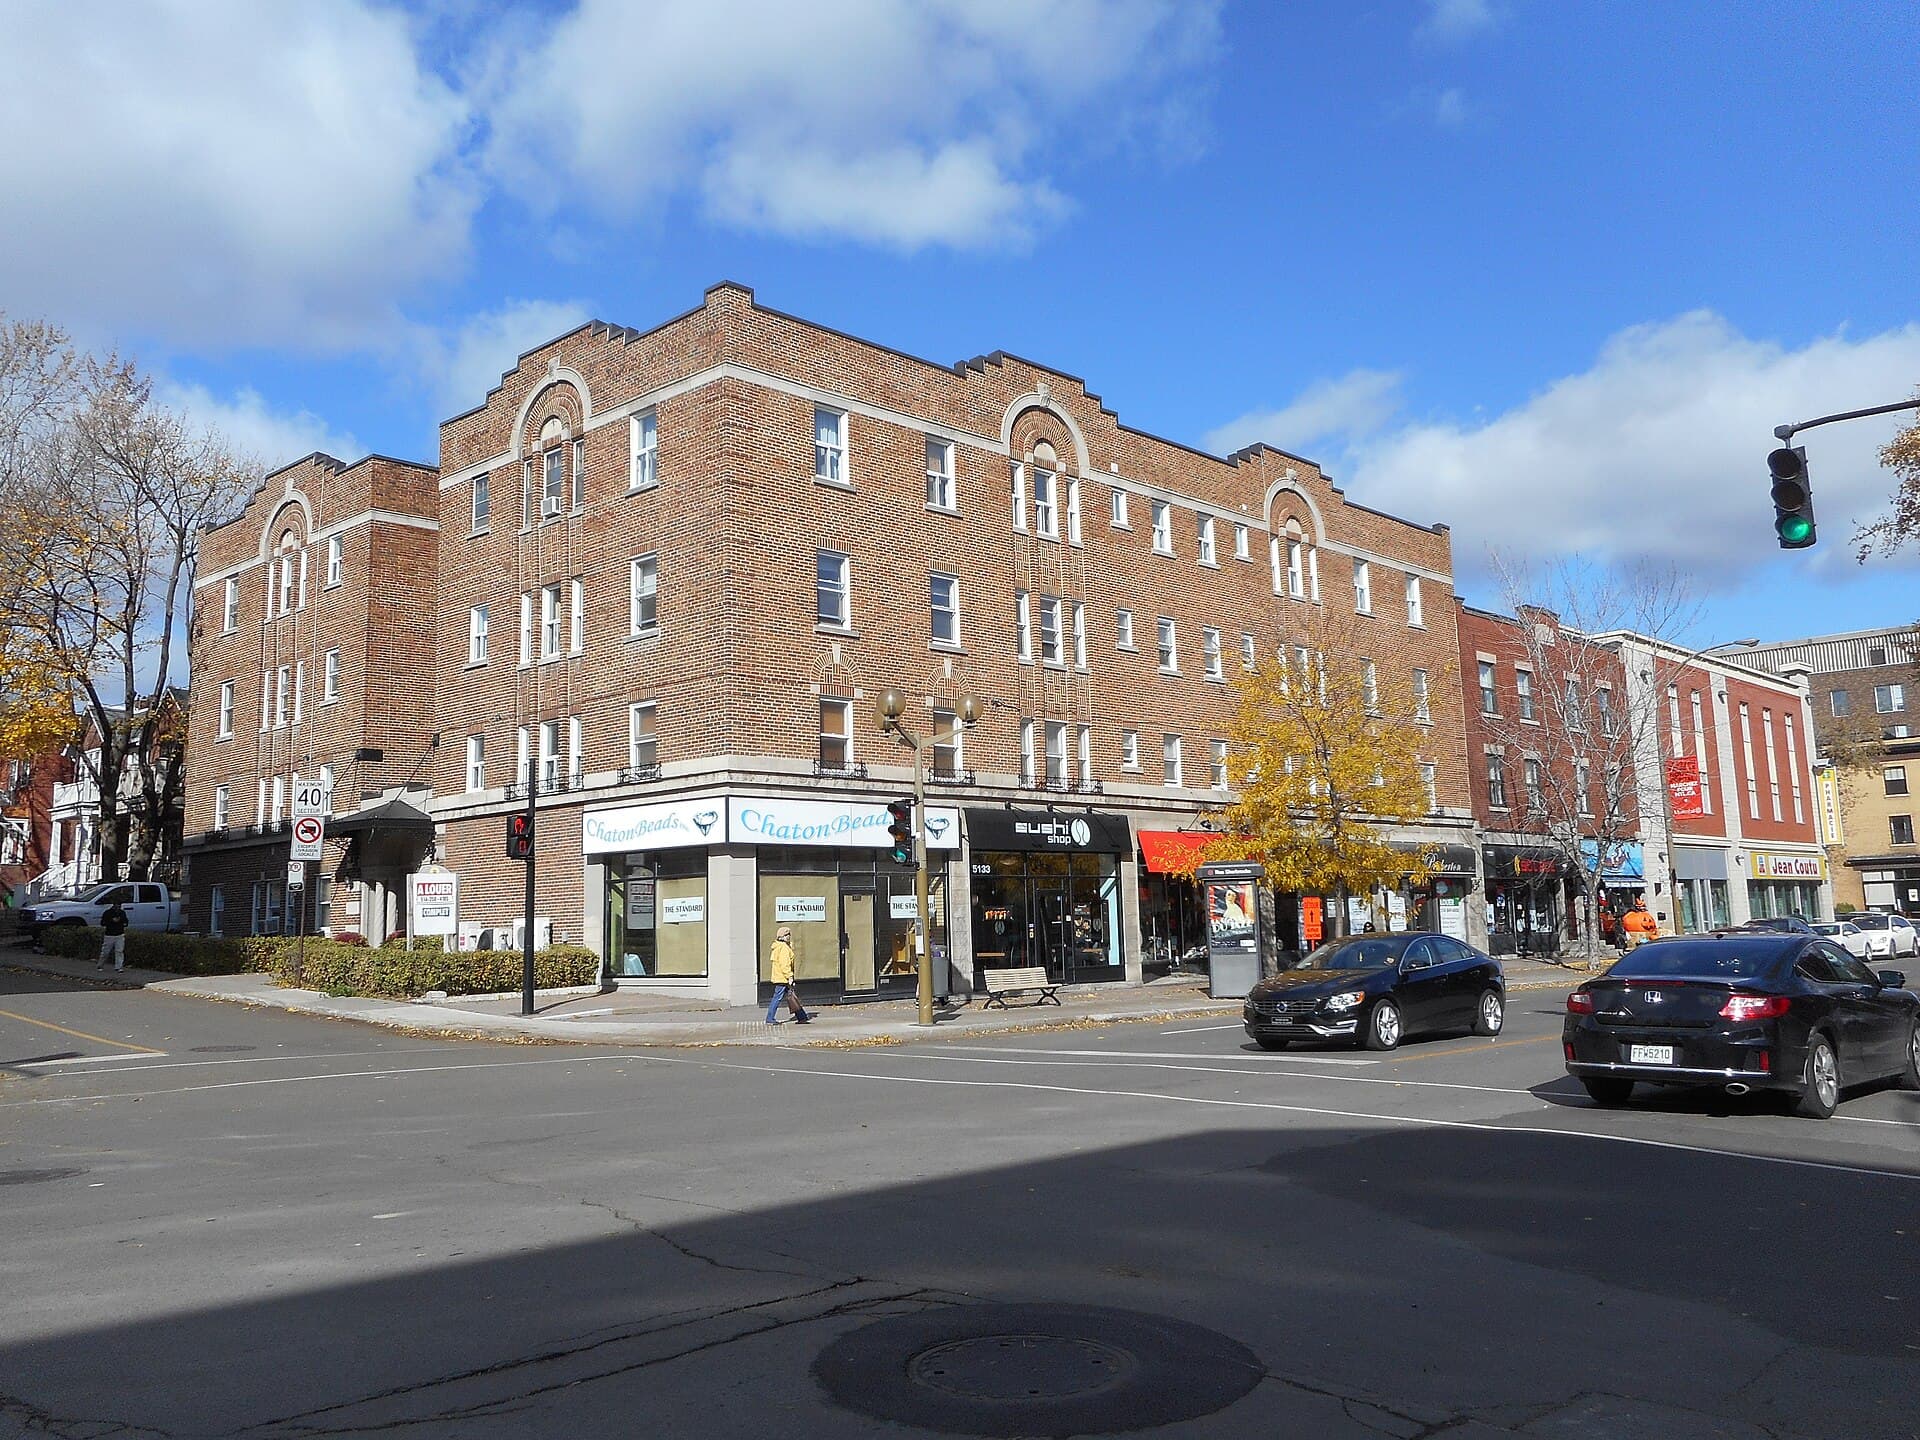
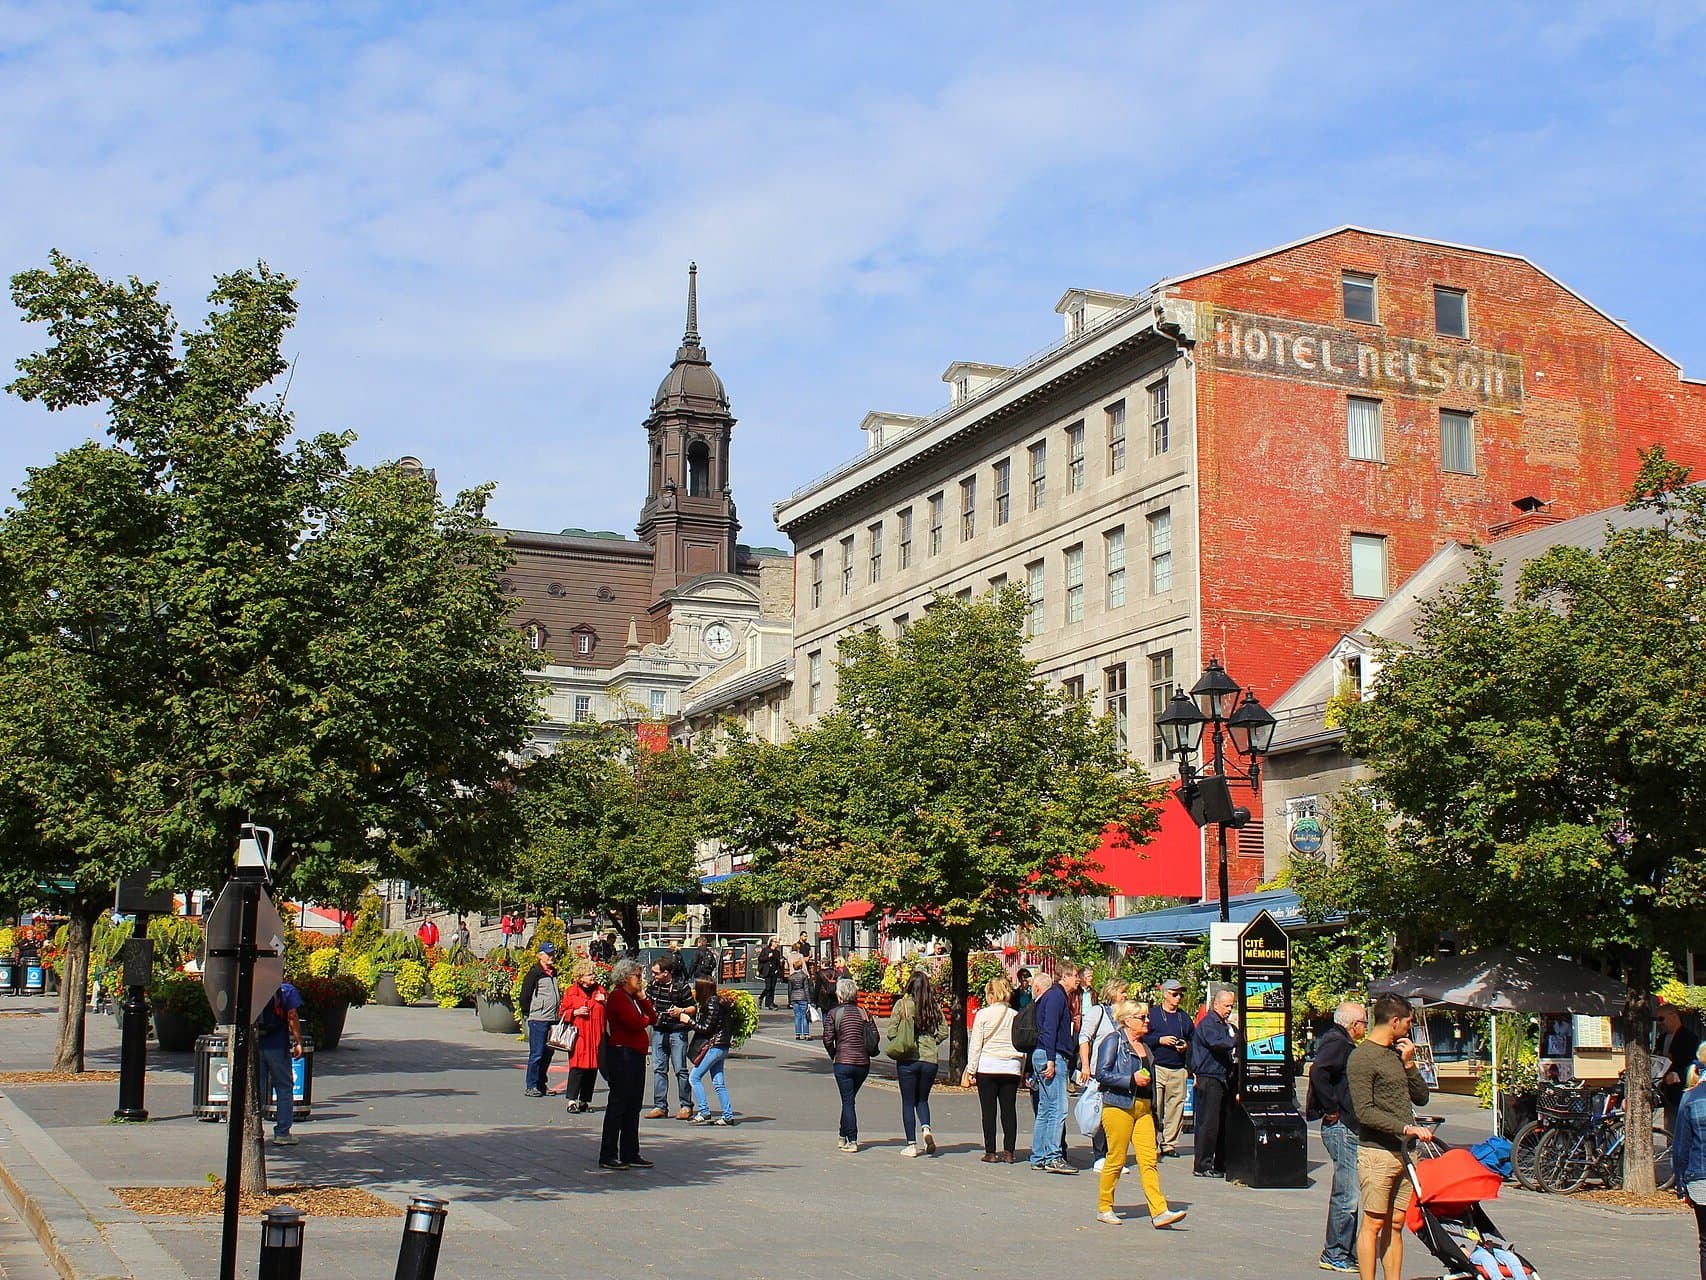
Bernard, Laurier and Van Horne avenues gather shops, cafés and restaurants.
Character properties
A variety of character properties and an active cultural and community life.
Neighbourhood essentials
Nearby places
Results provided by Google, not verified by our team.
Places verified by our team
Selling in Outremont
Selling a character property in Outremont starts with a precise reading of its architecture, condition and street, followed by a pricing strategy and marketing tailored to it, through to support at signing.
Get my Outremont property valued
Buying in Outremont
Between character homes, plexes and condominiums, buying in Outremont starts with clarifying your criteria and financing, then comparing available properties to prepare an offer suited to this sought-after market.
Talk to a buyer's brokerProperties available in Outremont
No properties available right now
No active property currently matches the Outremont sector. New properties may be added regularly.
Property types and reading the area
Every property in Outremont is analyzed based on its type — character home, plex or condominium —, its condition, its architecture and its location within the area, taking genuinely relevant comparables into account. It's this detailed reading of the area, rather than generic data, that guides pricing and strategy.
- Character home
- Condominium
- Residential heritage
- Relevant comparables
Our method in Outremont
- Analysis — Understanding the data, comparables and positioning specific to Outremont.
- Strategy — Pricing, preparation and marketing suited to your property.
- Support — Structured follow-up through to signing.
The team behind Outremont

Marc Lefrançois, CFA
Team Leader Chartered Real Estate Broker, Agency Executive Officer

Chantal Baillargeon
Real Estate Broker

Loris Jean Touffet
Residential Real Estate Broker

François Deslandres
Real Estate Broker

Ming Xi Cui
Residential Real Estate Broker

Jean-Jacques Juliard
Residential Real Estate Broker
Frequently asked questions
Market value depends on comparable sales, location, condition, property features and current market conditions. An online estimate is a starting point; a complete analysis may require a consultation and property visit.
Timing depends on the market as well as your next move, timeline, financing and property condition. A consultation helps compare scenarios instead of relying on seasonality alone.
The process includes market analysis, pricing, preparation recommendations suited to the area's architectural style, marketing assets and launch planning. Exact details are confirmed together in the listing agreement.
Quebec rules strictly govern representation and generally prohibit a residential broker from representing both a buyer and a seller who are each bound by brokerage contracts in the same transaction. A specific situation should be explained in accordance with OACIQ rules.
The team serves Greater Montreal, with an initial strategic and editorial focus on Town of Mount Royal, Outremont, Westmount and central Montreal neighbourhoods.
Ready to know your property's value?
A documented read on your property, its neighbourhood and today's market — no obligation.